

Documentation Index
Fetch the complete documentation index at: https://docs.asymptotelabs.ai/llms.txt
Use this file to discover all available pages before exploring further.
Dashboard Testing
The Beacon endpoint dashboard is a local-only, read-only UI for inspecting the runtime JSONL log. Use it after health checks and validation events to confirm that local events are visible to an analyst.Open the dashboard
Start the dashboard and open it in your browser:Test Log Search
Write a validation event, then open Log Search and confirm the event appears in the table.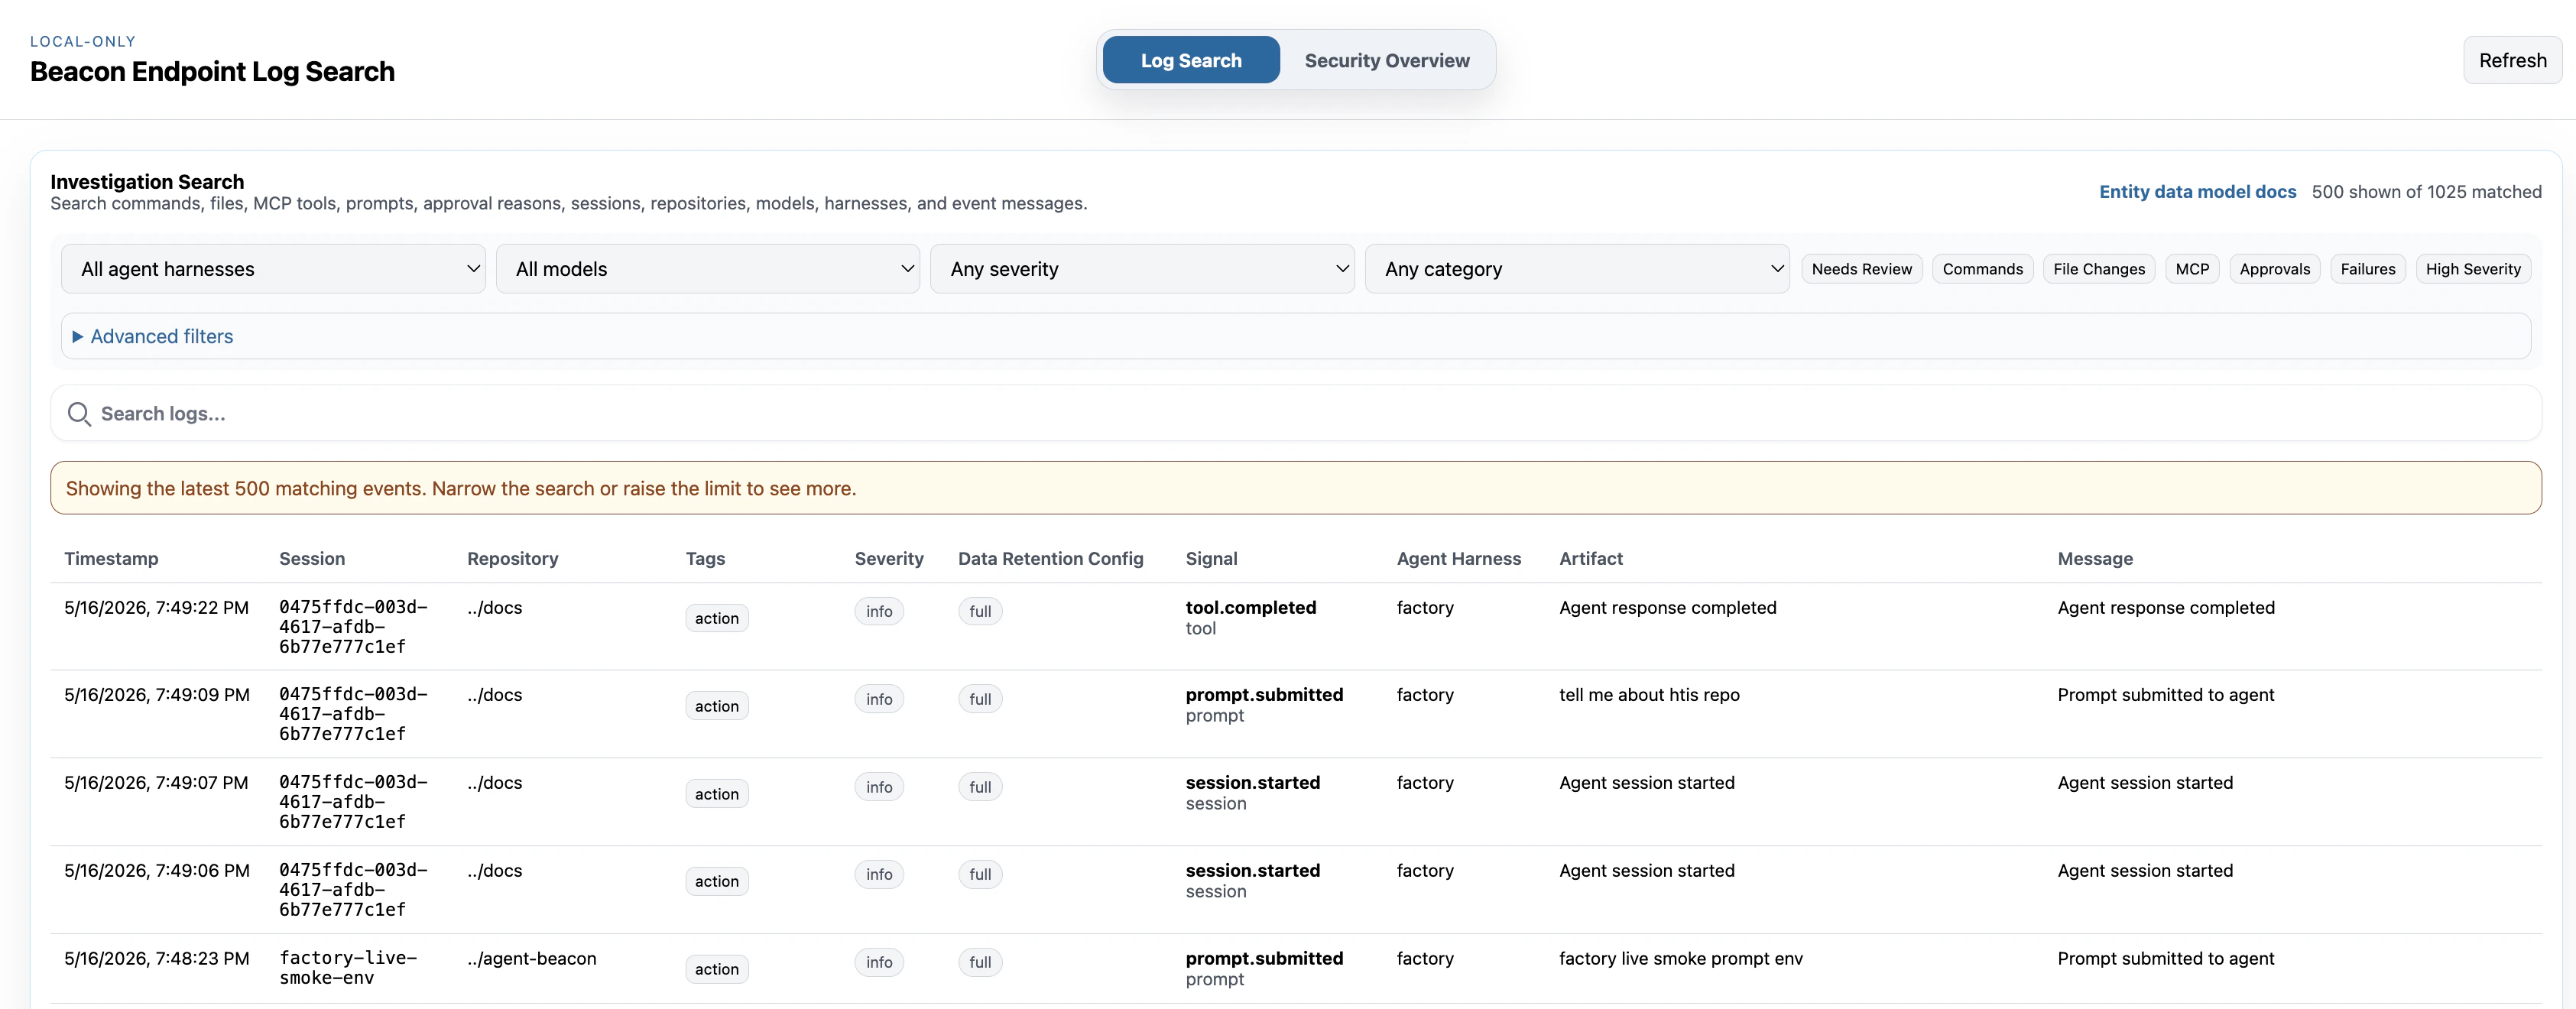
Test Security Overview
Open Security Overview after writing test events or generating local agent activity. Confirm the summary cards and inventory panels reflect the local runtime log you are testing.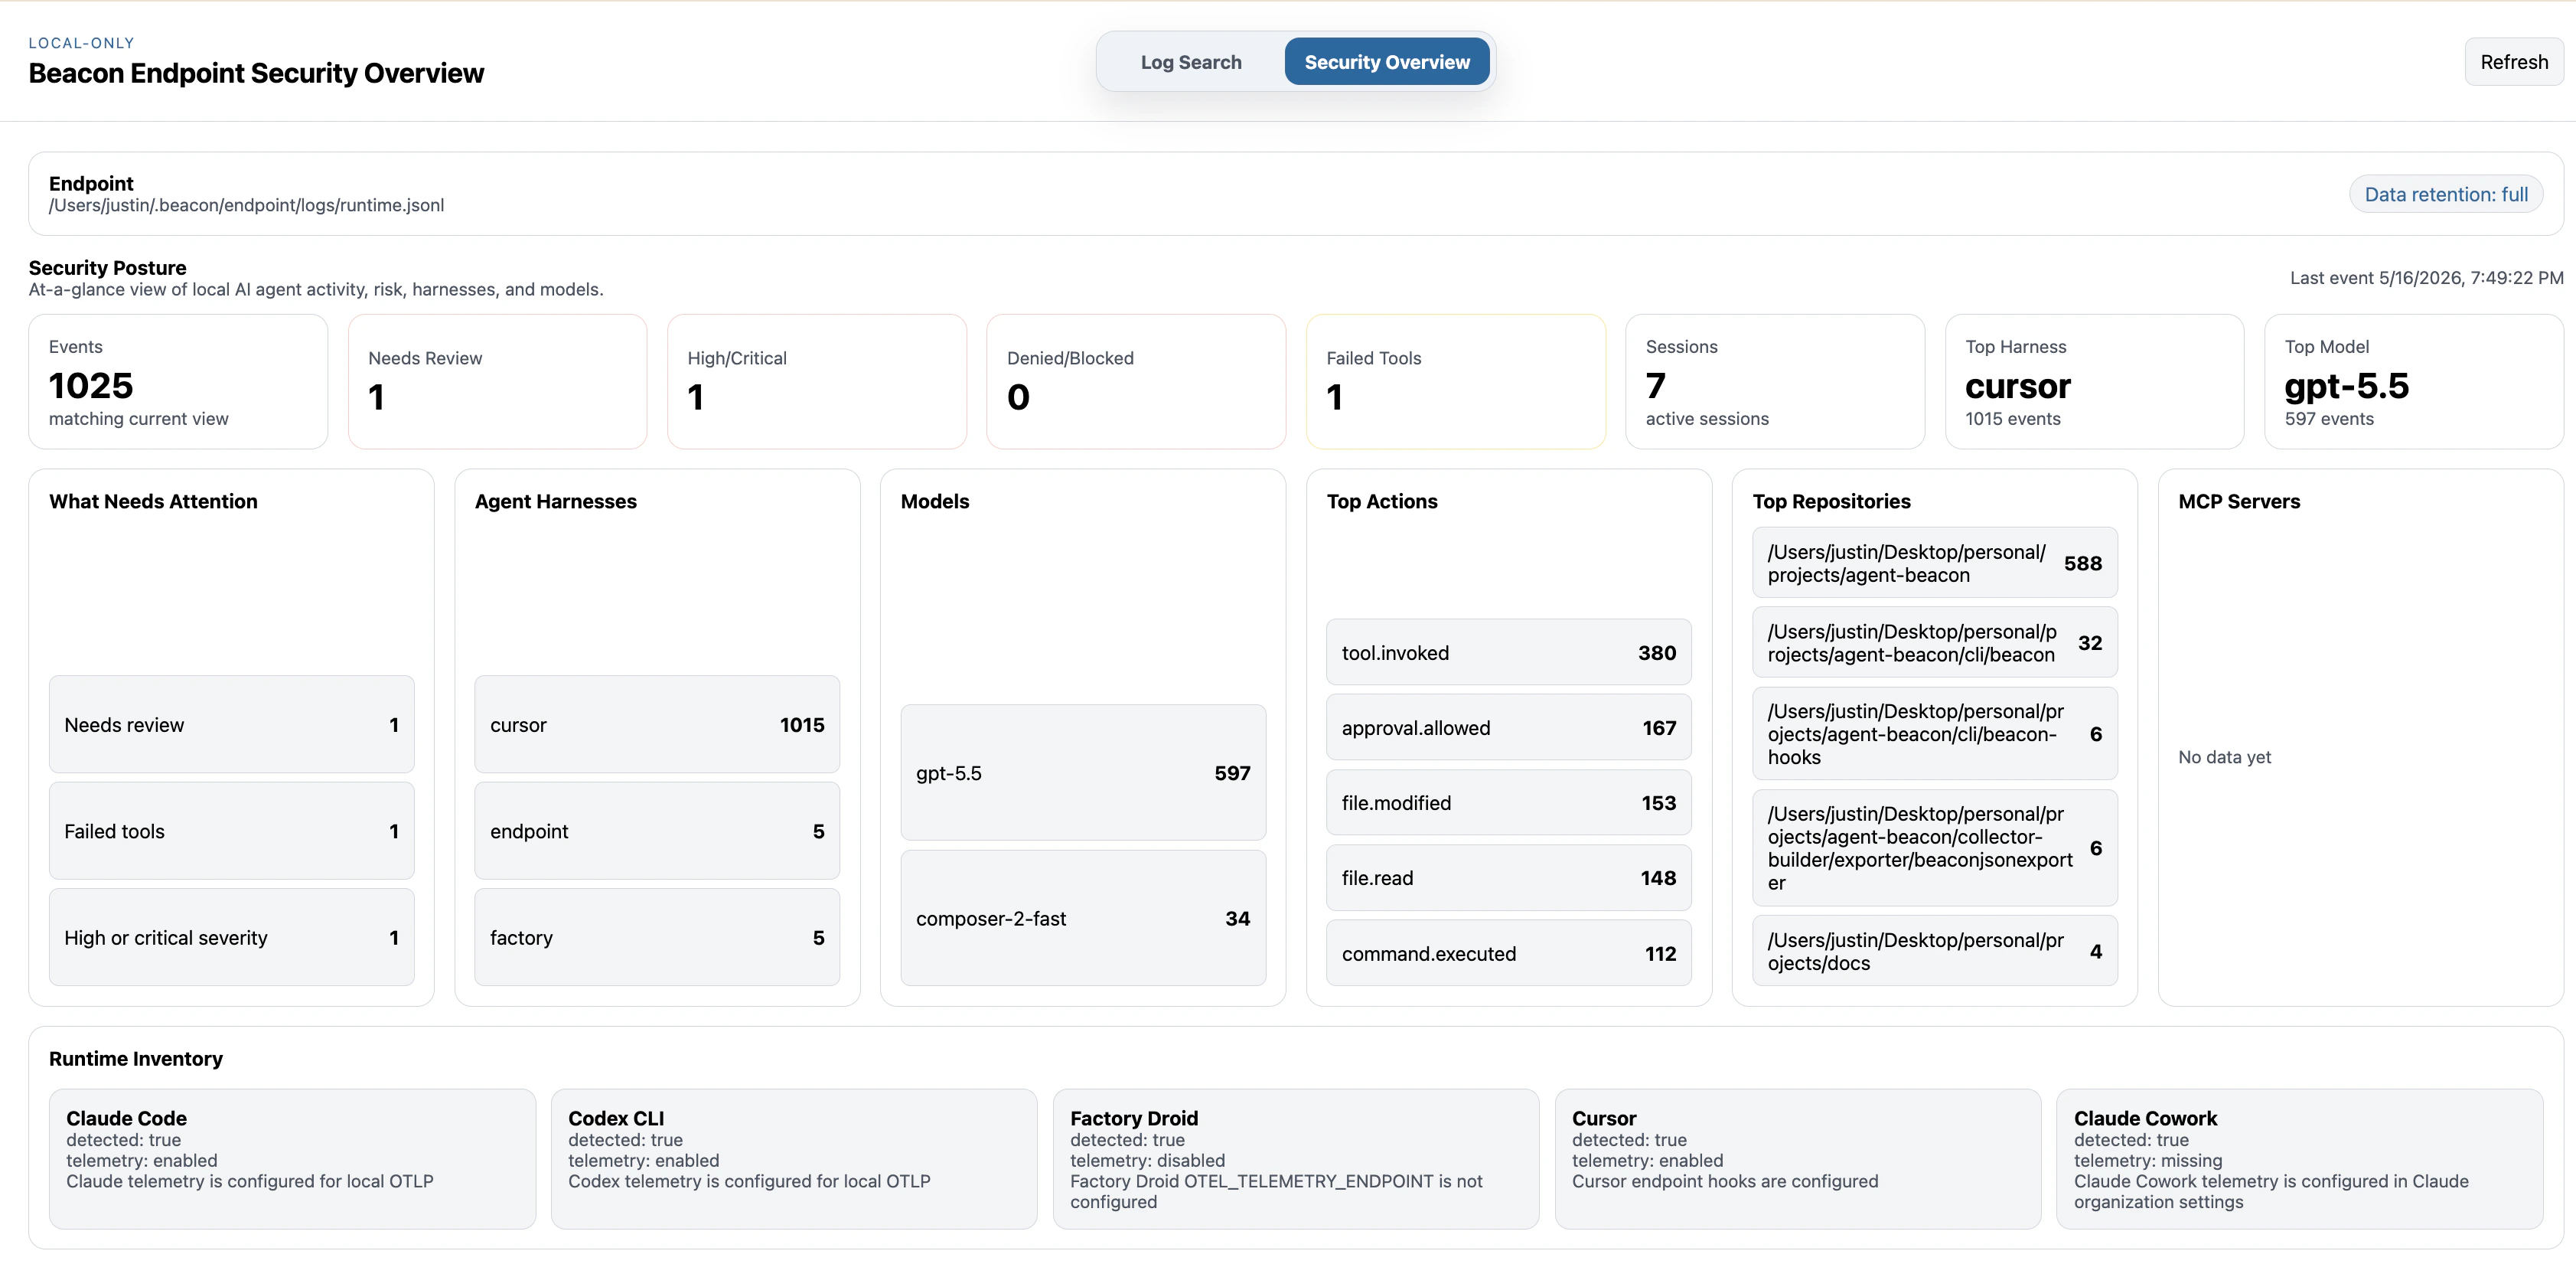
Troubleshooting
If the dashboard opens but does not show expected events, check:- The runtime log path shown by
beacon endpoint status. - Whether the validation event was written with
beacon endpoint test-event. - Whether you are testing user mode or system mode.
- Whether
--log-pathpoints at the same file you validated. - Whether the expected event is in the active log or one of the numbered archives next to it.
Related
beacon endpoint dashboard
Review all dashboard flags and command examples.
Validation events
Write a synthetic event before testing dashboard visibility.
Health checks
Confirm endpoint readiness before opening the dashboard.
Local logs
Confirm the dashboard is reading the intended runtime JSONL log.