

Overview
Agent Beacon is the open-source telemetry layer for AI agents wherever they run: on laptops, in the browser, inside application code, in CI, and in provider-managed cloud sandboxes. Each surface reports activity differently, so Beacon extends OpenTelemetry where a runtime emits it and instruments custom hooks, plugins, and adapters where it does not, then normalizes what it captures into a single event model.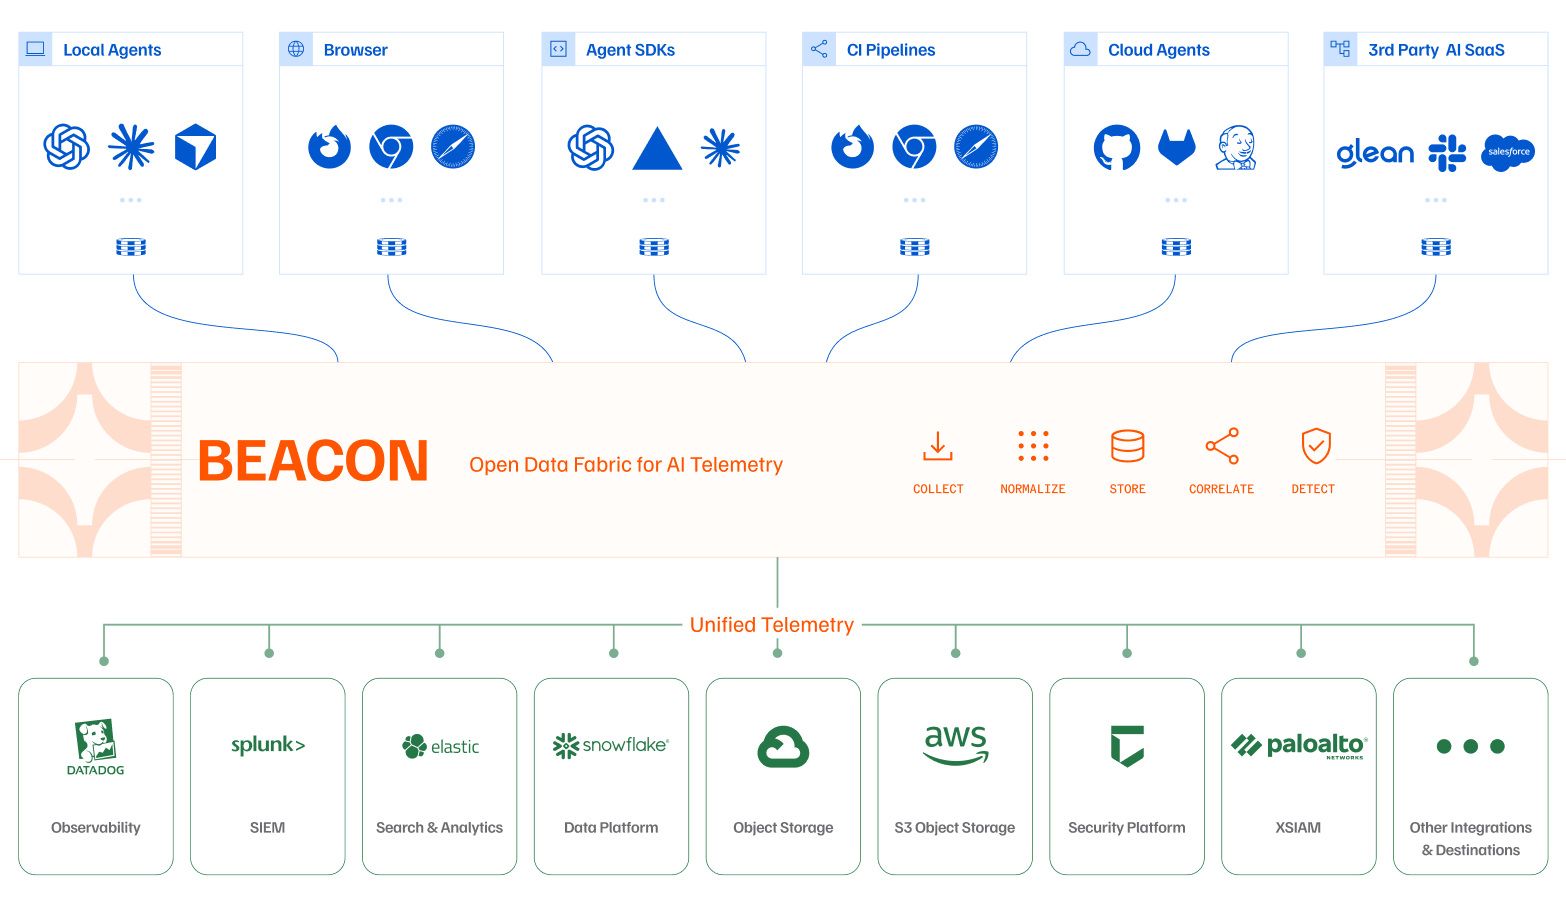
The endpoint architecture is local-first. Collection, normalization, storage, correlation, and detection all run on the machine, and nothing leaves it unless you configure forwarding. CI and cloud-agent paths reuse the same event model through surface-specific setup rather than a persistent endpoint service.
Collection surfaces
Local agents
Supported agent harnesses on an endpoint use the strongest surface each runtime exposes, rather than forcing every tool through one adapter: native hooks, a Beacon-managed plugin or extension, local OTLP export, or a read of the session records the runtime commits to disk. The endpoint package installs the CLI, runs the local collector as a service, and configures supported runtimes to export to it. See Runtime surface overview for per-harness coverage and Agent harness integration model for how discovery and configuration work.Browser
Chat activity on supported sites is collected by an optional Chrome extension that reads the page’s chat stream and posts OTLP logs to the local collector on127.0.0.1:4318. It writes no files and contacts no remote endpoint. Coverage is deliberately narrow: only the supported chat origins, never general browsing. See Browser Extension.
Agents in code
Agent applications, services, workers, and serverless functions are instrumented with the Asymptote Observe SDK, which emits Beacon-compatible OpenTelemetry spans for model calls, tool calls, and agent steps. There is no endpoint agent in this path: the SDK exports to a customer-managed collector or to hosted Observe. See SDK integrations.CI pipelines
Ephemeral build jobs do not install a persistent service.beacon ci exec or beacon ci start / beacon ci finish run a temporary collector for the life of the job and leave a completed runtime.jsonl behind. Publish it as a workflow artifact or upload it downstream. See CI Telemetry Exports.
Cloud agents
Provider-managed cloud agents runbeacon-hooks inside the sandbox, write /tmp/beacon/runtime.jsonl, and upload a compressed per-run snapshot directly to customer-managed Google Cloud Storage or Amazon S3. This path uses neither the persistent endpoint collector nor Vector. See beacon cloud, Claude Code Cloud Agents, and Cursor Cloud Agents.
Third-party AI SaaS appears on the diagram as a source category. The open-source build ships no collection path for it today: Beacon does not authenticate to SaaS accounts or read their audit logs. See Scope boundaries.
The Beacon pipeline
Collect
Beacon writes an OpenTelemetry Collector configuration with loopback receivers, and the hook adapter accepts native runtime payloads on the same machine.
The generated pipeline receives logs, traces, and metrics locally, batches them, and applies memory limits. Packaged deployments use the bundled Beacon collector distribution; local installs can point at another
beacon-otelcol binary with --collector. The collector runs as a service per platform: launchd on macOS in user mode or system mode, a systemd unit on Linux, and a Windows service.
Normalize
Logs, traces, metrics, resource attributes, and hook payloads are mapped into one event model through thebeaconjson exporter and the hook adapter. Every event carries a stable action plus the typed context its source provided: endpoint, user, harness, origin, run, session, tool, command, file, MCP, approval, policy, prompt, content, token usage, and destination.
Two provenance markers travel with every event so a reader can tell how it was obtained: harness.collection_method records the mechanism (hook, otlp, plugin, poll) and event.fidelity records whether the runtime named the action (observed) or Beacon derived it (inferred). See Normalization and the endpoint event schema.
Generic process and runtime OTLP metrics are filtered out of the log by default so timelines stay focused on prompts, tools, approvals, and file activity. Use --include-runtime-metrics when low-level process, runtime, or harness metrics are required.
Store
Beacon writes one JSON object per line to the runtime JSONL log.runtime.jsonl is the stable handoff boundary. Beacon rotates the active file at 10 MiB and keeps five numbered local archives, and the active path stays stable so dashboards and shippers can follow it. Most downstream integrations read from that preserved output, so the local audit trail stays intact regardless of what is forwarded.
Correlate
Events from every surface share session, run, tool-call, and event identifiers, so one agent session reconstructs as an ordered timeline instead of disconnected records.gen_ai.tool.call.id carries the runtime’s own name for a tool invocation, and event.id is derived from the event itself, so a hook and an OTLP capture of the same action agree on identity.
The local dashboard reads recent runtime logs over a loopback-only service for rollout validation and investigation, with Log Search, Detections and Findings, and a Security Overview. Token attribution rolls up through the dashboard token view and beacon token-usage. The dashboard is read-only: it inspects local state and never mutates endpoint configuration or telemetry.
Detect
beacon scan runs the open threat rules format over the runtime log and emits findings. Rules are YAML with CEL match conditions over the event schema; a rule can match a single event or correlate ordered steps inside a session window. The engine ships in the binary while the rule corpus is external data managed by beacon rules.
Scanning is read-only and offline. Only the explicit, user-initiated beacon rules pull <url> reaches the network. See Detections.
Destinations
Everything below the pipeline consumes the same normalized stream. Beacon does not become a hosted dependency in this band: with two exceptions, destinations read the local JSONL rather than receiving a push from Beacon.
Data platforms and security platforms shown on the diagram without a named content pack, such as a warehouse or an XDR pipeline, are reached this way: the customer’s own pipeline reads Beacon JSONL from the endpoint or from a bucket Beacon writes to.
Vector forwarding
Use Vector forwarding when a customer-managed host agent should tailruntime.jsonl without storing destination secrets in Beacon endpoint configuration.
- Beacon remains the local JSONL producer.
- Vector tails the active log path, checkpoints offsets, batches events, and retries delivery.
- Each JSONL line is parsed back into the original Beacon event, so downstream systems receive Beacon’s event shape rather than a Vector wrapper.
Direct collector export
Splunk HEC and Falcon LogScale HEC are the two exceptions to the read-from-disk pattern. When either is configured, the collector also sends logs, traces, and metrics directly to that exporter while preserving the local log. See SIEM forwarding for destination-specific setup.End-to-end flow
- A supported runtime emits activity through hooks, a plugin, OTLP, a session store, or the SDK.
- Beacon receives the signal locally and attaches endpoint and harness context.
- Beacon normalizes surface-specific payloads into the endpoint event schema.
- Beacon writes the event to the active
runtime.jsonlfile. - Operators correlate sessions in the dashboard, run detections with
beacon scan, and forward the stream to their security stack.
Scope boundaries
Beacon collects agent runtime telemetry and local endpoint configuration context. It does not do kernel or process monitoring, shell history collection, cloud audit ingestion, general browser or SaaS activity monitoring outside the supported chat surfaces, or credential-use attribution. See Data flow and threat model.Related
Runtime surface overview
See which agent harnesses are supported on each surface and what they capture.
Data flow and threat model
Review the security boundaries, local collection path, and optional forwarding behavior.
Endpoint event schema
Review normalized Beacon JSONL event fields.
SIEM forwarding
Configure forwarding to SIEM, log aggregation, and storage destinations.
Detections
Run threat rules over local telemetry and review findings.
Managed architecture
See how Asymptote Managed centralizes telemetry, policy, detections, and investigations.