> ## Documentation Index
> Fetch the complete documentation index at: https://docs.asymptotelabs.ai/llms.txt
> Use this file to discover all available pages before exploring further.
# beacon endpoint dashboard
> Run the local Beacon endpoint dashboard
## Command Overview
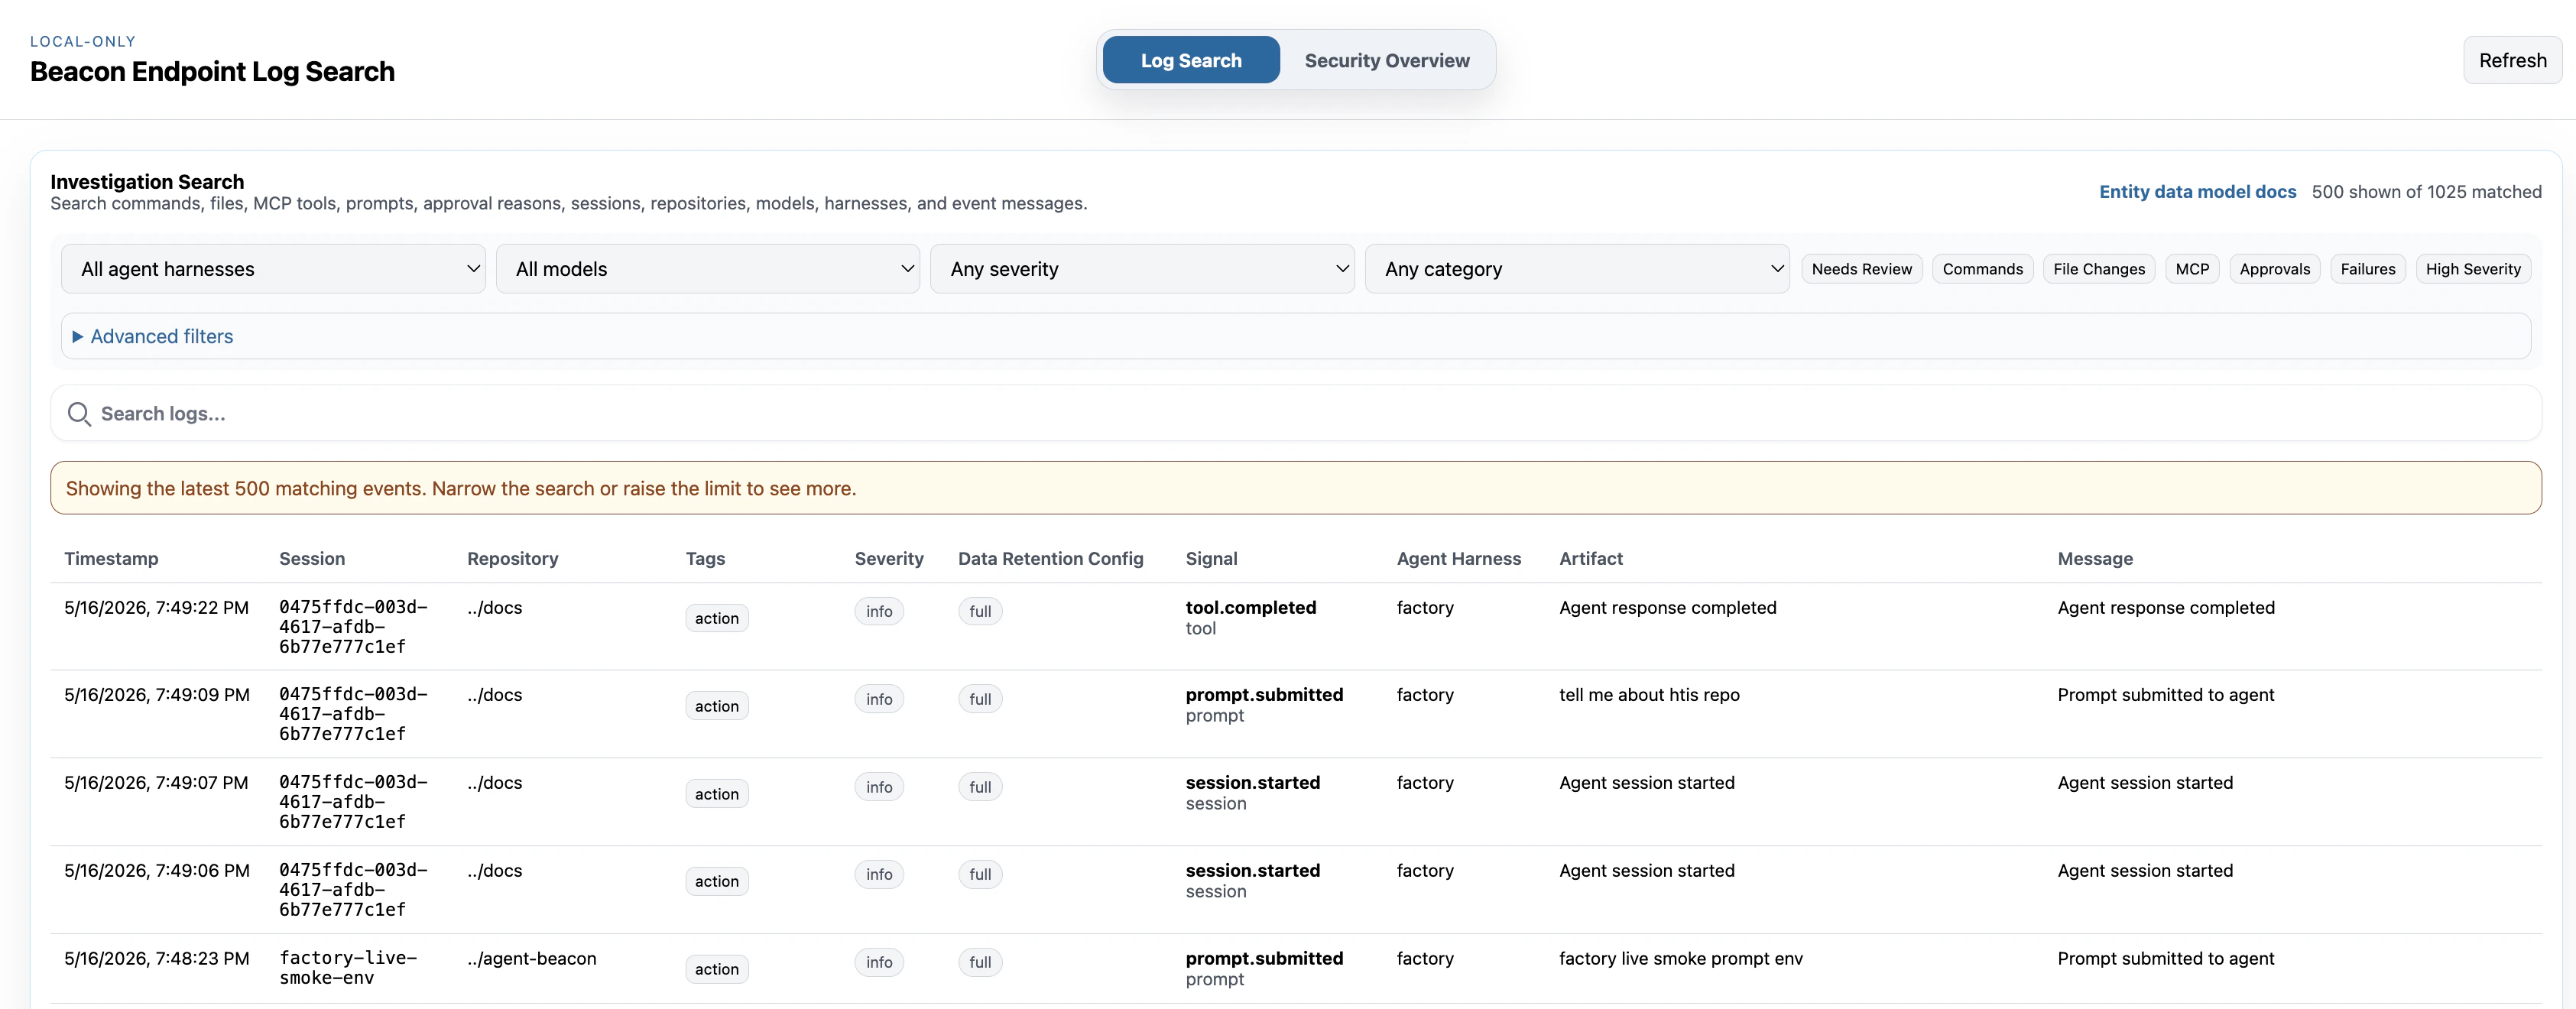
Beacon includes a local-only dashboard for investigating the runtime JSONL log. The dashboard binds to loopback by default, has no external network dependency during normal use, and is intended for local investigation rather than remote administration.
 ```bash title="Command syntax" theme={null}
beacon endpoint dashboard
```
Start the local dashboard, open it in a browser, or bind it to a custom local address.
## What it shows
The dashboard reads the configured runtime JSONL log and provides a read-only view of local Beacon events. It follows Beacon's local rotation pattern, so Log Search can include the active file and numbered archives such as `runtime.jsonl.1`. In the default CLI setup, it reads the same per-user log used by Antigravity CLI, Claude Code, Cursor, Devin CLI, Devin Desktop, Factory, Grok Build, Hermes Agent, and OpenCode hooks, Claude Code OTLP, Codex OTLP, optional Gemini CLI OTLP, Factory Droid OTLP, and OpenClaw Gateway OTLP telemetry.
* **Log Search:** investigate event rows with free-text search, harness, model, severity, and category filters.
* **Detections:** browse the active [threat-rule](/detections) set that Beacon would use for local scans, including rules installed in the local store or the built-in baseline when no store is installed.
* **Findings:** run the active rules over the configured runtime log on demand and review matching evidence with severity and session filters.
* **Quick filters:** focus on high-severity events, failures, approvals, MCP activity, file changes, commands, and events that may need review.
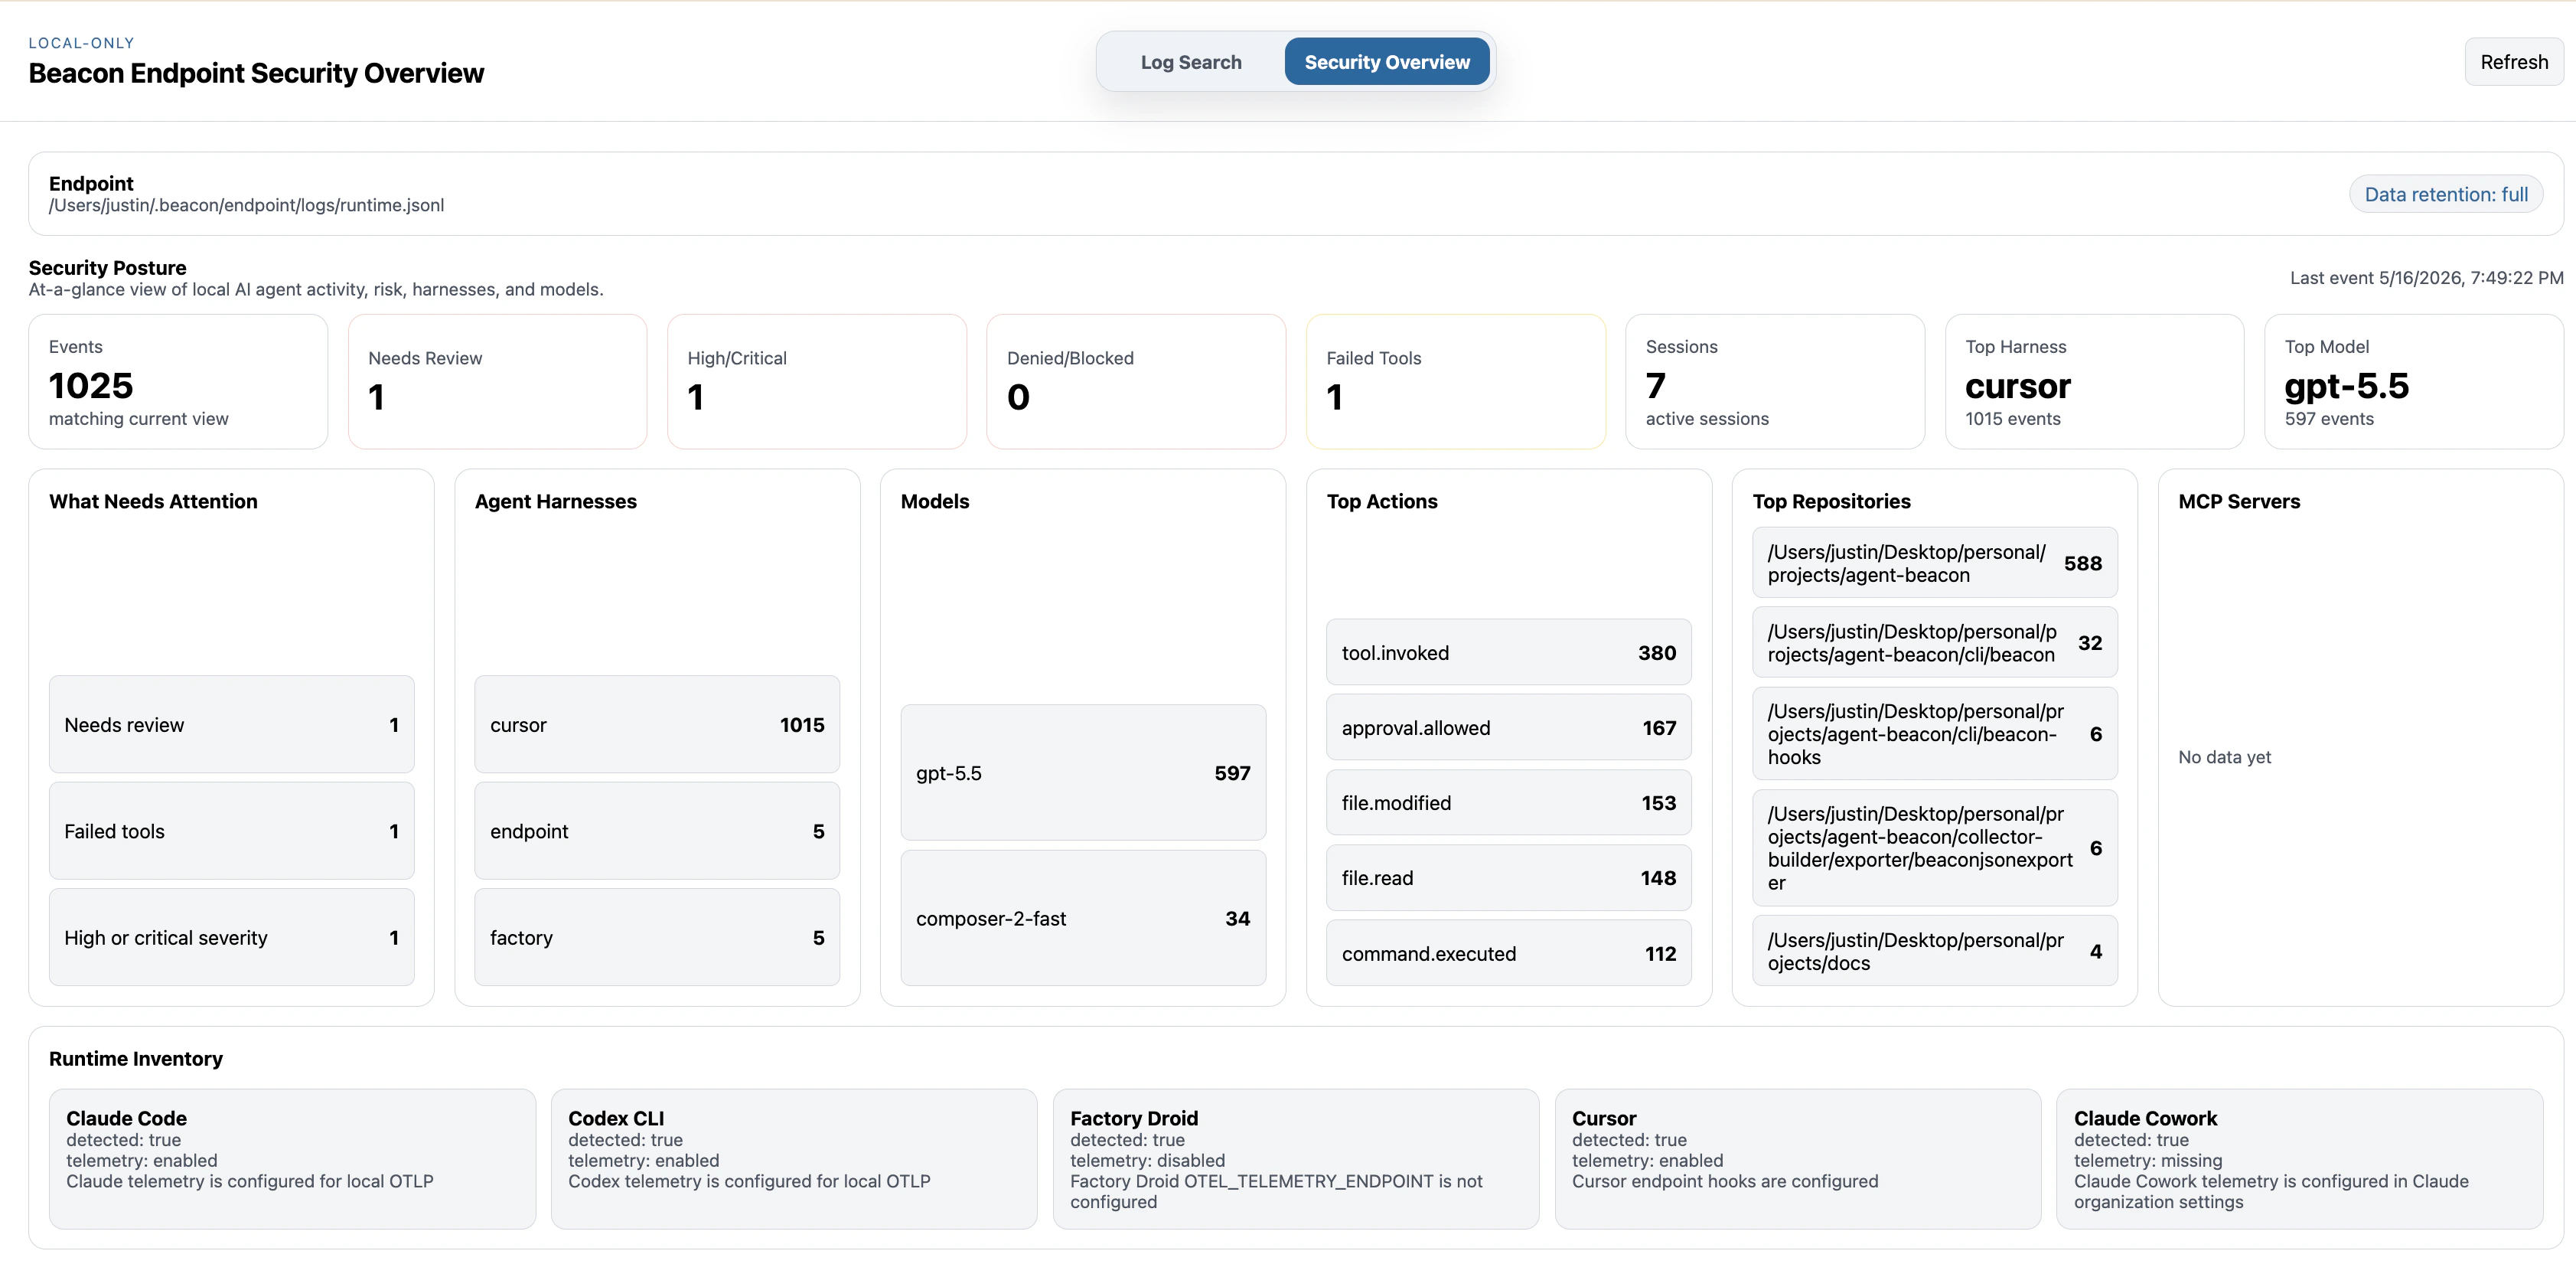
* **Security Overview:** review event totals, needs-review counts, high or critical activity, denied or blocked activity, failed tools, sessions, top harnesses, top models, top repositories, and MCP servers.
* **Runtime inventory:** inspect [Inventory Local Agent Runtimes](/guides/inventory) for detected harnesses and telemetry status across supported local runtimes.
* **Runtime-log source:** see source details and warnings when a system collector may be writing OTLP events to a different log.
* **Rotated archives:** open event details from active or archived runtime logs, even when older archive numbers have already been pruned.
The Detections and Findings screens mirror the same local rule resolution and scan behavior used by [`beacon scan`](/cli/scan). They do not fetch rule packs, mutate telemetry, or require a hosted Beacon account.
## Flags
| Flag | Description |
| -------------------- | ----------------------------------------------- |
| `--user` | Use per-user endpoint paths. Enabled by default |
| `--system` | Use system endpoint paths and launch daemon |
| `--log-path ` | Runtime JSONL log path |
| `--addr ` | Local dashboard listen address |
| `--open` | Open the dashboard in a browser |
## beacon endpoint dashboard
`beacon endpoint dashboard` starts a local-only dashboard for inspecting Beacon runtime JSONL events.
```bash title="Open the local dashboard" theme={null}
beacon endpoint dashboard
```
The dashboard binds to loopback by default and reads the configured runtime log and its local rotated archives. It is intended for local investigation, not remote administration.
### Examples
Start the dashboard:
```bash title="Start the dashboard" theme={null}
beacon endpoint dashboard
```
Open the dashboard in your browser:
```bash title="Open the dashboard in your browser" theme={null}
beacon endpoint dashboard --open
```
Use a custom local address:
```bash title="Use a custom local address" theme={null}
beacon endpoint dashboard --addr 127.0.0.1:8765
```
Inspect a custom runtime log:
```bash title="Inspect a custom runtime log" theme={null}
beacon endpoint dashboard --log-path /path/to/runtime.jsonl
```
During normal use, the dashboard has no external network dependency. It reads local Beacon logs and serves a local read-only UI from a loopback address.
## Related
Understand the rule format, detection flow, and findings model.
Run the same active rules from the command line.
Understand configured, detected, and observed local runtime coverage.
Print endpoint inventory from the command line or as JSON.
```bash title="Command syntax" theme={null}
beacon endpoint dashboard
```
Start the local dashboard, open it in a browser, or bind it to a custom local address.
## What it shows
The dashboard reads the configured runtime JSONL log and provides a read-only view of local Beacon events. It follows Beacon's local rotation pattern, so Log Search can include the active file and numbered archives such as `runtime.jsonl.1`. In the default CLI setup, it reads the same per-user log used by Antigravity CLI, Claude Code, Cursor, Devin CLI, Devin Desktop, Factory, Grok Build, Hermes Agent, and OpenCode hooks, Claude Code OTLP, Codex OTLP, optional Gemini CLI OTLP, Factory Droid OTLP, and OpenClaw Gateway OTLP telemetry.
* **Log Search:** investigate event rows with free-text search, harness, model, severity, and category filters.
* **Detections:** browse the active [threat-rule](/detections) set that Beacon would use for local scans, including rules installed in the local store or the built-in baseline when no store is installed.
* **Findings:** run the active rules over the configured runtime log on demand and review matching evidence with severity and session filters.
* **Quick filters:** focus on high-severity events, failures, approvals, MCP activity, file changes, commands, and events that may need review.
* **Security Overview:** review event totals, needs-review counts, high or critical activity, denied or blocked activity, failed tools, sessions, top harnesses, top models, top repositories, and MCP servers.
* **Runtime inventory:** inspect [Inventory Local Agent Runtimes](/guides/inventory) for detected harnesses and telemetry status across supported local runtimes.
* **Runtime-log source:** see source details and warnings when a system collector may be writing OTLP events to a different log.
* **Rotated archives:** open event details from active or archived runtime logs, even when older archive numbers have already been pruned.
The Detections and Findings screens mirror the same local rule resolution and scan behavior used by [`beacon scan`](/cli/scan). They do not fetch rule packs, mutate telemetry, or require a hosted Beacon account.
## Flags
| Flag | Description |
| -------------------- | ----------------------------------------------- |
| `--user` | Use per-user endpoint paths. Enabled by default |
| `--system` | Use system endpoint paths and launch daemon |
| `--log-path ` | Runtime JSONL log path |
| `--addr ` | Local dashboard listen address |
| `--open` | Open the dashboard in a browser |
## beacon endpoint dashboard
`beacon endpoint dashboard` starts a local-only dashboard for inspecting Beacon runtime JSONL events.
```bash title="Open the local dashboard" theme={null}
beacon endpoint dashboard
```
The dashboard binds to loopback by default and reads the configured runtime log and its local rotated archives. It is intended for local investigation, not remote administration.
### Examples
Start the dashboard:
```bash title="Start the dashboard" theme={null}
beacon endpoint dashboard
```
Open the dashboard in your browser:
```bash title="Open the dashboard in your browser" theme={null}
beacon endpoint dashboard --open
```
Use a custom local address:
```bash title="Use a custom local address" theme={null}
beacon endpoint dashboard --addr 127.0.0.1:8765
```
Inspect a custom runtime log:
```bash title="Inspect a custom runtime log" theme={null}
beacon endpoint dashboard --log-path /path/to/runtime.jsonl
```
During normal use, the dashboard has no external network dependency. It reads local Beacon logs and serves a local read-only UI from a loopback address.
## Related
Understand the rule format, detection flow, and findings model.
Run the same active rules from the command line.
Understand configured, detected, and observed local runtime coverage.
Print endpoint inventory from the command line or as JSON.